

Economic Bulletin Issue 6, 2026
Summary
At its meeting on 10 September 2026, the Governing Council decided to raise the three key ECB interest rates by 25 basis points. The conflict in the Middle East continues to generate inflation pressures, and inflation is set to remain well above target for an extended period. The decision to raise interest rates underscores the Governing Council’s commitment to setting monetary policy to ensure that inflation stabilises at its 2% target in the medium term.
The baseline of the September 2026 ECB staff macroeconomic projections for the euro area sees headline inflation averaging 3.0% in 2026, 2.5% in 2027 and 2.1% in 2028. For inflation excluding energy and food, the baseline foresees 2.5% in 2026, 2.6% in 2027 and 2.3% in 2028. Compared with the June 2026 Eurosystem staff macroeconomic projections for the euro area, the baseline projection for inflation in 2026 is unchanged, while it has been revised up for 2027 and 2028. The baseline projection for economic growth is 0.9% for 2026, 1.4% for 2027 and 1.5% for 2028. This is an upward revision for both 2026 and 2027, mainly reflecting the greater than expected resilience of the euro area economy.
The outlook remains highly uncertain, with risks to the upside for inflation and to the downside for economic growth. In relation to the energy shock, the updated scenarios put together by staff illustrate the broad range of outcomes for how growth and inflation would evolve under different assumptions about its intensity and duration, as well as its indirect and second-round effects. These scenarios were published as part of the September 2026 projections on the ECB’s website.
With its decision on 10 September, the Governing Council remains well positioned to navigate the uncertainty caused by the conflict in the Middle East. It will follow a data-dependent and meeting-by-meeting approach to determining the appropriate monetary policy stance. In particular, the Governing Council’s interest rate decisions will be based on its assessment of the inflation outlook and the risks surrounding it, in light of the incoming economic and financial data, as well as the dynamics of underlying inflation and the strength of monetary policy transmission. The Governing Council is not pre-committing to a particular rate path.
Economic activity
The economy proved resilient in the second quarter of 2026, despite headwinds from the energy shock. Growth was broad-based across countries and sectors. This pattern is likely to have continued into the third quarter. Manufacturing continues to perform solidly as governments spend more on defence and infrastructure. Consumer confidence has rebounded from low levels, helping services recover from the initial energy shock. Increased AI-related activity is visible in digital services, business investment and exports.
The labour market has remained robust, with the unemployment rate unchanged in July at 6.4%. Growth in employment and the labour force continues to slow, while productivity has gradually picked up.
Looking ahead, the near-term growth outlook has improved compared with the June 2026 projections, reflecting, in particular, the resilience of private consumption and public spending. Over the medium term, consumption should be supported by gradually falling energy prices and a strong labour market. Growth will increasingly be bolstered by business and housing investment. Export growth should benefit from rising foreign demand but is being held back by competitiveness challenges and uncertainty about global trade policies.
Higher potential growth requires structural reform and has to be underpinned by sound public finances. Simplifying and harmonising rules across the EU’s Single Market, accelerating the energy transition and completing the savings and investments union are key building blocks. As the process for agreeing on the legal framework for the digital euro moves into its final stage, the Governing Council reiterated the importance of reaching agreement on the Single Currency package as quickly as possible. Fiscal responses to the energy shock should be temporary, targeted and tailored.
Inflation
In August 2026 inflation increased to 3.3%, from 2.9% in July. Energy price inflation rose to 14.3%, after 10.3% in July. This increase is likely to reflect, in particular, a strong contribution from refining margins on liquid fuels, as well as higher energy commodity prices. Food price inflation remained unchanged at 1.2%. Inflation excluding energy and food edged down to 2.4%, from 2.5% in July, with goods inflation increasing from 0.9% to 1.2% and services inflation falling from 3.3% to 3.0%.
Most measures of underlying inflation were broadly stable in July. Wages do not show a material response to the energy shock at this stage. Compensation per employee grew at an annual rate of 3.3% in the second quarter of 2026, down from 3.5% in the first quarter. Rising labour productivity has also helped contain growth in unit labour costs, which slowed to 2.6%, from 3.5% in the first quarter. At the same time, growth in unit profits rose from 0.3% to 2.2%. Looking ahead, the ECB’s wage tracker points to a modest uptick, to 2.7%, in negotiated wage growth in the first half of 2027. Inflation expectations over shorter horizons remain at elevated levels, but most measures of longer-term inflation expectations stand at around 2%, supporting the stabilisation of inflation around target in the medium term.
The conflict in the Middle East and recent developments in Russia’s unjustified war against Ukraine have pushed the path of energy prices up further. This is likely to keep headline inflation well above target into the first half of 2027. Thereafter, energy inflation should decline and turn negative up to mid-2028, bringing headline inflation down. Higher energy prices are expected to feed through gradually to core and food price inflation. The improved economic outlook should also contribute to slightly higher core inflation, which is expected to keep rising until early 2027 and stay elevated for the rest of the year, before moderating in 2028. Overall, headline inflation is expected to return to around target towards the end of 2027, supported by the effects of higher interest rates. The Governing Council will continue to monitor closely the size and persistence of the energy price increase and how it feeds through to price and wage-setting, inflation expectations and overall economic dynamics.
Risk assessment
The risks to the growth outlook are to the downside. This is due, in particular, to the Middle East conflict and developments in Russia’s unjustified war against Ukraine. Renewed disruption of energy supplies could cause energy prices to rise further and for longer than currently expected. This would weigh on real incomes, spending and investment. A worsening of global financial market sentiment or spillovers in global bond markets could tighten credit conditions and thereby dampen demand. A resurgence of trade tensions between major economies could also further disrupt supply chains, reduce exports and weaken consumption and investment. By contrast, growth could turn out to be higher if the economy and energy markets were to adapt more quickly than expected to the disruption caused by the ongoing conflicts or if these were resolved sustainably. Moreover, the adoption of new technologies by euro area firms and spending on defence and infrastructure, as well as reforms to enhance productivity and complete the EU’s Single Market, may drive up growth by more than expected.
The risks to the inflation outlook are to the upside. This is due, in particular, to the Middle East conflict and developments in Russia’s unjustified war against Ukraine. The energy shock could intensify further and its effects on other prices and wages could be stronger than currently expected. Gas prices, in particular, could increase in the event of further supply disruptions or an unusually cold winter coinciding with low storage levels. The longer energy prices stay high, the more likely they are to drive up broader inflation through indirect and second-round effects. Renewed trade tensions could give rise to more fragmented global supply chains, curtail the supply of critical raw materials and worsen capacity constraints in the euro area economy. Extreme weather events, potentially reinforced by intensifying “El Niño” conditions, and the unfolding climate and nature crises more broadly, could drive up food prices by more than expected. By contrast, inflation could turn out to be lower if ongoing geopolitical conflicts were resolved sustainably or if indirect or second-round effects from the recent energy price shock proved less pronounced than anticipated. More volatile and risk-averse financial markets could weigh on demand and thereby lower inflation as well.
Financial and monetary conditions
Market interest rates have increased since the Governing Council’s meeting on 23 July 2026, reflecting similar moves in global markets. Following the interest rate increase in June 2026, bank lending rates for firms have risen, to stand at 3.8% in June and July, from 3.6% in May. The cost of market-based corporate debt stood at 4.0% in July, which was similar to previous months and well above its level before the conflict in the Middle East. The annual growth rate of bank lending to firms, which usually responds to changes in monetary policy with a longer delay, increased further to 4.4% in July, from 4.0% in May and June. The annual growth rate of corporate bond issuance was 3.4%, after 3.6% in June and 3.3% in May. Mortgage rates were unchanged in June and July, at 3.5%, while mortgage lending growth softened to 3.0% in July, from 3.1% in May and June.
Monetary policy decisions
At its meeting on 10 September 2026, the Governing Council decided to raise the three key ECB interest rates by 25 basis points. Accordingly, the interest rates on the deposit facility, the main refinancing operations and the marginal lending facility were increased to 2.50%, 2.65% and 2.90% respectively, with effect from 16 September 2026.
The asset purchase programme and the pandemic emergency purchase programme portfolios are declining at a measured and predictable pace, as the Eurosystem no longer reinvests the principal payments from maturing securities.
Conclusion
The Governing Council is committed to setting monetary policy to ensure that inflation stabilises at its 2% target in the medium term. It will follow a data-dependent and meeting-by-meeting approach to determining the appropriate monetary policy stance. The Governing Council’s interest rate decisions will be based on its assessment of the inflation outlook and the risks surrounding it, in light of the incoming economic and financial data, as well as the dynamics of underlying inflation and the strength of monetary policy transmission. The Governing Council is not pre-committing to a particular rate path.
In any case, the Governing Council stands ready to adjust all of its instruments within its mandate to ensure that inflation stabilises sustainably at its medium-term target and to preserve the smooth functioning of monetary policy transmission.
1 External environment
The global economy remained resilient in the second quarter of 2026 as sustained investment related to artificial intelligence (AI) offset headwinds from the conflict in the Middle East. Activity held up better than expected as stronger momentum in AI-exporting economies, such as Malaysia, South Korea and Taiwan, and positive surprises in India more than offset weaker growth in the United States and China. Global trade surprised markedly on the upside, supported by AI-related shipments and temporary frontloading of tariff-sensitive and energy-intensive goods. Incoming indicators point to continued resilience in the third quarter. Global inflation rose in the second quarter in line with the June 2026 Eurosystem staff macroeconomic projections as higher energy costs fed through to consumer prices, while price pressures also intensified for AI-related goods. The global growth outlook in the September 2026 ECB staff macroeconomic projections has been revised slightly upwards compared with the June projections, reflecting easing supply shortages, stronger AI investment and lower oil prices. Global trade growth has been revised up more substantially, reflecting stronger second-quarter outturns and the high trade intensity of AI infrastructure investment. The global inflation outlook is unchanged, as the downward effect of lower crude oil prices and easing supply shortages is broadly offset by higher refining margins for petroleum products, higher gas prices and stronger price pressures for AI-related goods.
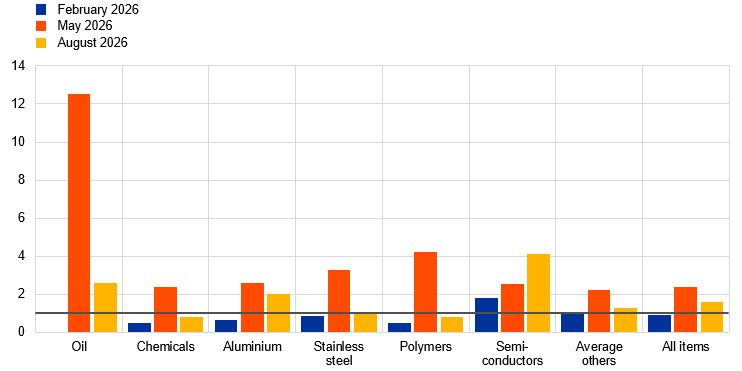
Global activity remained resilient in the second quarter of 2026, and incoming indicators point to continued strength in the near term. Available national accounts releases suggest that global real GDP excluding the euro area expanded by 0.8% quarter on quarter in the second quarter of 2026. Weaker growth in the United States and China was more than offset by stronger outturns in AI-exporting economies, such as Malaysia, South Korea and Taiwan, and by positive surprises for growth in India. Survey indicators strengthened further in August amid a strong increase in the global services output Purchasing Managers’ Index (PMI) and a global manufacturing index firmly in expansionary territory (Chart 1, panel a). Granular sectoral surveys continue to identify the technology sector as a key source of strength, whereas activity in consumer goods manufacturing moderated with the fading of the temporary boost from frontloading. Global PMI data indicate that supply shortages in energy-related sectors have eased markedly since May, while other sectors have remained unaffected – except for the semiconductor industry where shortages intensified amid strong AI-related demand (Chart 1, panel b). Incoming data point to robust global growth in the third quarter, with the ECB staff nowcasting tool indicating quarterly growth of around 1.0%, broadly in line with consensus expectations among private forecasters.
Chart 1
Global output PMI (excluding the euro area) and supply shortages
a) PMIs
(diffusion indices)

b) Supply shortages
(z-scores)
Sources: S&P Global Market Intelligence and ECB staff calculations.
Notes: In panel a), the horizontal line at 50 marks the neutral baseline dividing expansion and contraction. In panel b), “Average others” reports the average supply shortages for sectors not listed individually. Supply shortages are calculated from the number of purchasing managers that report a specific item to have been in short supply during the survey month and expressed in z-scores. A value of 1.0 (indicated by the grey line) means that supply shortages are in line with the long-run average. Values above (below) 1.0 indicate that supply shortages are assessed to be higher (lower) than normal. The latest observations are for August 2026.
The global growth outlook has been revised slightly upwards in the September 2026 ECB staff macroeconomic projections, reflecting stronger AI-related investment, easing supply shortages and more resilient private consumption in the United States. Global real GDP growth excluding the euro area is projected to moderate from 3.7% in 2025 to 3.1% in 2026, before recovering gradually to 3.3% in 2027 and 3.4% in 2028. Compared with the June 2026 projections, growth has been revised up by 0.1 percentage points for each year of the projection horizon (2026-28). The upward revisions reflect stronger investment in AI infrastructure in economies integrated into the technology value chain, a reassessment of the resilience of US consumption and a less adverse supply shock as supply shortages have eased since June. Nevertheless, projected global growth remains below its pre-pandemic average over the projection horizon.[1]
Renewed tensions in the Middle East pushed both oil and gas prices higher, with the increase in European gas prices amplified by low inventory levels. Oil prices rose by 18% over the review period (11 June to 9 September 2026), leaving prices 54% above levels prior to the conflict in the Middle East. Prices declined at the beginning of the review period following the signing of the Memorandum of Understanding between the United States and Iran but subsequently rebounded as the agreement failed to deliver a lasting de-escalation of the conflict. More recently, renewed strikes between the two parties raised concerns about the normalisation of oil flows through the Strait of Hormuz, adding further upward pressure. The price increase was partly offset by weaker demand, as elevated refining margins, driven by Middle East tensions and Ukrainian strikes on Russian refineries, weighed on oil consumption. European gas prices also rose sharply, by 62%, to around 150% of their levels prior to the Middle East conflict, as upward pressure from the conflict was compounded by historically low European inventories. Although low inventories may partly reflect previous reluctance to refill storage at high prices, they nevertheless raise concerns that market participants may need to rush to secure supplies ahead of the winter. Food prices increased by 22%, reflecting a rise in cocoa prices, as continued upward revisions to the strength of the El Niño episode this year heightened worries about the supply of cocoa. Price increases were also supported by wheat and corn prices, as the recent escalation of Russia’s war against Ukraine threatens cereal exports from the region. Metal prices rose by 1%, driven by London-traded copper prices. The increase reflected fears that the United States could impose tariffs on copper, prompting investors to redirect shipments to the United States ahead of their introduction and thereby raising prices outside the United States.
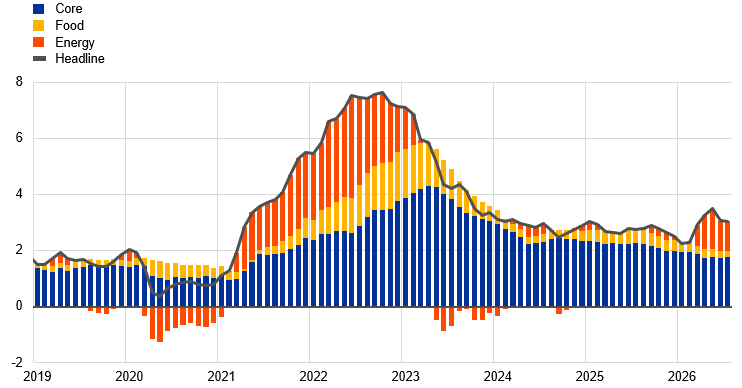
Global inflation declined in June and July 2026, after rising markedly in previous months, with energy inflation coming down. Global headline inflation across the member countries of the Organisation for Economic Co-operation and Development (OECD) excluding Türkiye declined to 3.0% in June and remained stable in July, after peaking at 3.5% in May (Chart 2). While the contribution of higher energy costs remained elevated, energy inflation fell from 16.0% in May 2026 to 11.9% in July as supply chain pressures eased. At the same time, price pressures increased for technology-related goods, especially in economies integrated into AI-related value chains. However, the exposure is concentrated in a narrow range of products with small weights in consumer baskets, such as laptops and smartphones. In the September 2026 ECB staff macroeconomic projections, global headline inflation is projected to rise from 3.1% in 2025 to 3.5% in 2026, before declining to 3.0% in 2027 and 2.5% in 2028.[2] The outlook is unchanged from the June projections, as the downward impact of lower crude oil prices and easing supply shortages are broadly offset by higher gas and food prices, wider refining margins and stronger price pressures for AI-related goods. The unresolved conflict in the Middle East, possible second-round effects and a stronger El Niño episode leave risks to global inflation tilted to the upside.
Chart 2
OECD CPI inflation
(year-on-year percentage changes, percentage point contributions)
Sources: OECD and ECB staff calculations.
Notes: The OECD aggregate includes euro area countries that are OECD members and excludes Türkiye. It is calculated using OECD consumer price index (CPI) annual weights. The latest observations are for July 2026.
Global import growth remained buoyant in the second quarter, driven by AI-related trade and temporary frontloading. Available national accounts releases indicate that global imports expanded by 1.8% quarter on quarter in the second quarter of 2026, markedly above the June 2026 Eurosystem staff macroeconomic projections. The large upside surprise reflects stronger-than-expected trade among Asian technology exporters, frontloading of US imports of consumer goods ahead of anticipated tariff measures in July and precautionary purchases of energy-intensive goods amid concerns about further supply disruptions. The temporary effects from frontloading are expected to fade, but the global AI investment cycle should continue to support trade. The strength of imports relative to activity reflects the high import-intensity of investment in data centres and related AI infrastructure, amplified by propagation through geographically dispersed global technology value chains. In the September 2026 ECB staff macroeconomic projections, global import growth is projected to stand at 4.7% in 2026 and 4.5% in 2027, before slowing to 3.5% in 2028. Compared with the June projections, this represents an upward revision of 0.5 percentage points for 2026 and 0.9 percentage points for 2027 owing to stronger second-quarter outturns and sturdier trade in AI and technology-related goods.
In the United States, domestic demand has remained resilient, supported by consumption and AI-related investment. Real GDP growth slowed to 0.4% quarter on quarter in the second quarter of 2026, as inventories and net trade weighed on activity, while final domestic demand remained robust. Private consumption expanded strongly, and investment continued to benefit from the AI build-out. However, the sources of growth have become more concentrated. Technology-related activity is estimated to have contributed one-third of GDP growth in the second quarter. The household saving rate fell to 2.7% in June, while wealth gains have accrued predominantly to higher-income households with sizeable equity holdings, leaving consumption more exposed to a correction in financial markets. Some correction from the strong second-quarter consumption spending is likely, with retail sales softening in July as temporary supporting factors and frontloading faded. In the September 2026 ECB staff macroeconomic projections, real GDP growth is projected to stand at 2.0% in each year from 2026 to 2028. Compared with the June projections, growth has been revised down by 0.1 percentage points in 2026 following the weaker second-quarter outturn, but up by 0.2 percentage points in 2027 and 0.1 percentage points in 2028 on account of more resilient private consumption and more dynamic AI infrastructure investment.
US inflation remains above target, while the signals from measures of underlying price pressures are mixed. Headline CPI inflation eased to 3.4% in July as energy prices declined, but price pressures have become visible in some technology-intensive consumer products, even though their weight in the overall inflation basket is limited. Core personal consumption expenditure (PCE) inflation remained above 3% in June, while trimmed-mean PCE inflation was close to 2%, highlighting the divergence across measures of underlying price pressures. This divergence may reflect the concentration of supply-side shocks in energy, tariffs and AI-related goods and makes it difficult to assess the extent to which inflationary pressures are easing. At the same time, the labour market appears broadly balanced and wage pressures remain contained, with the Employment Cost Index slowing in the second quarter and strong productivity growth limiting unit labour cost pressures. In the September 2026 ECB staff macroeconomic projections, headline CPI inflation is projected to average 3.4% in 2026, before declining to 2.9% in 2027 and 2.2% in 2028. The projection for 2026 has been revised up by 0.2 percentage points, mainly owing to stronger second-quarter outturns and higher prices for AI-related imports. At its July meeting, the Federal Open Market Committee kept the target range for the federal funds rate unchanged at 3.50-3.75%.
In China, the deterioration in domestic demand extended into the third quarter, despite continued support from exports and AI-related investment. Real GDP growth slowed to 0.9% quarter on quarter in the second quarter of 2026, reflecting weak household demand and the drag from higher energy prices. Activity indicators for July surprised on the downside, with annual growth in retail sales, industrial production and fixed asset investment all coming in significantly below consensus expectations. The residential property downturn continued to weigh on confidence, consumption and investment, while weaker income and labour market conditions added to the headwinds facing households. A People’s Bank of China household survey points to steadily weakening confidence in future income and current employment, consistent with slowing wage bill growth. Exports remained resilient, supported by AI-related demand, but imports also increased strongly. China’s goods surplus with the European Union (EU) continued to widen, reflecting the limited exposure of the EU to AI-related import demand in China. Export prices moved out of deflationary territory, with AI-related products accounting for about two-thirds of total export price inflation in May 2026. In the September 2026 ECB staff macroeconomic projections, real GDP growth is projected to decline from 5.1% in 2025 to 4.5% in 2026, 4.3% in 2027 and 4.0% in 2028. Compared with the June projections, growth has been revised down by 0.2 percentage points in 2026 following the weak second-quarter outturn, but up by 0.2 percentage points in 2027 owing to stronger AI infrastructure investment. Headline CPI inflation is projected to remain subdued at 1.2% in 2026, 1.3% in 2027 and 1.5% in 2028 amid persistent economic slack and weak household demand.
In the United Kingdom, economic activity proved more resilient than expected in the second quarter, while higher household energy bills pushed inflation up in July. Real GDP expanded by 0.4% quarter on quarter in the second quarter of 2026, supported mainly by private investment and consumption, and survey indicators pointed to modest growth at the start of the third quarter. In the September 2026 ECB staff macroeconomic projections, real GDP is projected to grow by 1.2% in both 2026 and 2027 and by 1.5% in 2028. The projections for 2026 and 2027 have been revised up by 0.2 and 0.1 percentage points respectively, reflecting the stronger second-quarter outturn and easing supply shortages. Headline CPI inflation rose from 2.6% in June to 2.9% in July, mainly owing to the increase in the regulated energy price cap, while core inflation remained unchanged at 2.6%. Evidence of indirect and second-round effects remains limited, with household inflation expectations easing and private wage growth moderating. Headline inflation is projected at 3.0% in 2026, 2.7% in 2027 and 2.0% in 2028. At its July meeting, the Bank of England kept its policy rate unchanged at 3.75%.
2 Economic activity
Euro area growth exceeded expectations in the second quarter of 2026, rising to 0.6%, quarter on quarter, supported by domestic demand and exports as well as a strong rebound in Irish GDP. Even excluding volatile Irish data, economic growth remained robust at 0.3%, quarter on quarter, despite the conflict in the Middle East. Recent information points to continued growth in the third quarter, although the geopolitical landscape remains challenging. Manufacturing should continue to benefit from spending on defence and digital technologies, as well as from firms building up inventories to mitigate supply chain risks. Meanwhile, activity in the services sector is set to continue its recovery, following the marked weakening caused by the energy shock in the wake of the conflict in the Middle East, supported, inter alia, by strong demand related to artificial intelligence (AI). At the same time, firms appear to be cautious in their staffing decisions, hiring less but also not displacing an increasing number of workers, leaving the unemployment rate unchanged. Over the medium term, strengthening private consumption, investment in new digital technologies and AI-related activity, government spending on defence and infrastructure, along with some recovery in exports, should all support growth momentum.
This outlook is reflected in the September 2026 ECB staff macroeconomic projections for the euro area, which foresee annual average real GDP growth of 0.9% in 2026, 1.4% in 2027 and 1.5% in 2028. Compared with the June 2026 Eurosystem staff macroeconomic projections for the euro area, GDP growth has been revised slightly up for 2026, reflecting a greater than expected resilience, as illustrated by upward data surprises and positive survey indicators. The more positive than anticipated developments in 2026 imply a carry-over effect in 2027, leading to an upward revision, while headline growth is unrevised for 2028. The economic outlook for the euro area remains highly uncertain amid the ongoing conflict in the Middle East and continued volatility in energy prices. To take account of this uncertainty, the baseline is complemented by updated versions of the milder, adverse and severe scenarios contained in the June 2026 projections.[3]
The euro area economy proved resilient in the second quarter of 2026, with broad-based growth across sectors and countries. According to the latest Eurostat estimate, euro area real GDP rose by 0.6%, quarter on quarter, in the second quarter of 2026, after displaying zero growth in the first quarter. When excluding volatile data for Ireland, real GDP growth came out at 0.3%, the same as in the first quarter. Growth dynamics in the domestic demand components varied in the second quarter (Chart 3). Private and public consumption growth both remained positive, while investment contracted slightly further. At the same time, changes in inventories contributed negatively to GDP growth. Although net trade was strongly positive in the headline figures, it was more muted when volatile Irish trade flows were excluded. Production in the second quarter was driven by both industry and services, with the latter once again supported by the information and communication services sector. Momentum in the construction sector strengthened vis-à-vis the first quarter, leading to a rebound in growth. Developments in the manufacturing sector were mostly positive across the euro area economies but were strongly affected by volatility in some countries – in particular, a 22% increase reported by Ireland. While the sector is still facing headwinds stemming from higher tariffs and geopolitical uncertainty, it is also being supported by increasing production related to the defence industry. Notwithstanding the notable differences across countries, most Member States displayed positive GDP growth in the second quarter of 2026.
Chart 3
Euro area real GDP and its components
(quarter-on-quarter percentage changes; percentage point contributions)

Sources: Eurostat and ECB calculations.
Notes: The chart also shows GDP excluding Ireland, as Irish data are particularly volatile. However, the subcomponents display the GDP breakdown including Ireland. The latest observations are for the second quarter of 2026.
Recent information points to continued growth in economic activity in the third quarter of 2026, even though the geopolitical landscape remains challenging. The euro area composite output Purchasing Managers’ Index (PMI) rose to an average of 52.0 over July and August, a clear improvement compared with the contractionary signals seen in the second quarter (49.1). This improvement was broad-based across sectors, pointing to a continued resilience of the euro area. While the manufacturing output index rose from 51.8 to 53.1 over the same period, the services business activity index recovered from 48.2 to 51.7 (Chart 4). This suggests that the manufacturing sector should continue to hold up on the back of defence and infrastructure spending, as well as firms accumulating inventories to mitigate supply chain risks.[4] Meanwhile, activity in the services sector is set to continue its recovery, following the marked weakening induced by the energy shock. Forward-looking survey results for new orders indicate a more pronounced improvement in services than in industry. Moreover, while supplier delivery times are assessed to be longer than normal, they shortened in July and August compared with the second quarter. The European Commission’s business and consumer surveys portray a similar picture of strengthening across sectors in the third quarter.
Chart 4
PMI indicators across sectors of the economy
a) Manufacturing |
b) Services |
|---|---|
(diffusion indices) |
(diffusion indices) |
 |
 |
Source: S&P Global Market Intelligence.
Note: The latest observations are for August 2026.
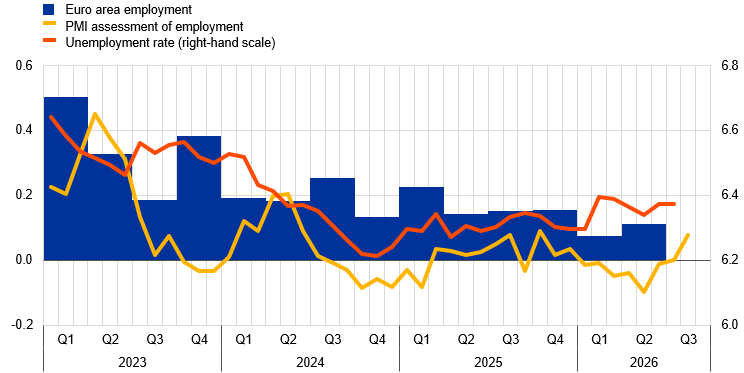
The labour market continues to cool down but at a slower pace than in recent months. Firms continued to reduce hiring, with year-on-year employment growth rates easing slightly to 0.50% in the second quarter of 2026 from 0.53% in the first quarter and an average of 0.7% in 2025. At the same time, workforce adjustment appears to be gradual, with no significant increase in layoffs, leaving the unemployment rate at 6.4% in July, unchanged from June. The unemployment rate has been broadly stable since mid-2024 (Chart 5). Furthermore, growth in the labour force slowed in the second quarter compared with the first quarter, partly reflecting a decline in inward migration, which had strongly supported this growth between 2022 and 2024 (see Box 3). Coinciding with the moderation in employment growth and the pick-up in GDP growth, annual productivity growth edged up to 0.7% in the second quarter, after recording no growth in the first quarter. Productivity excluding the effects of volatile GDP data from Ireland also grew 0.7%, year on year, in the second quarter, and has shown a persistent and strengthening recovery over recent quarters.
Chart 5
Euro area employment, PMI assessment of employment and unemployment rate
(left-hand scale: quarter-on-quarter percentage changes, diffusion index; right-hand scale: percentages of the labour force)
Sources: Eurostat, S&P Global Market Intelligence and ECB calculations.
Notes: The two lines indicate monthly developments, while the bars show quarterly data. The PMI is expressed in terms of the deviation from 50, then divided by 10 to gauge quarter-on-quarter employment growth. The latest observations are for the second quarter of 2026 for euro area employment, August 2026 for the PMI assessment of employment and July 2026 for the unemployment rate.
Short-term labour market indicators suggest that the weakening labour market may be showing early signs of bottoming out. The monthly composite PMI employment index increased in August for the third month in a row. The subindices for services and manufacturing rose, pointing to still muted, but slightly improving employment sentiment, while the subindex for construction declined. At the same time, online job postings on Indeed continued to fall in August, albeit at a slower pace than in recent months, and soft information from corporate earnings calls suggests that firms are talking less about both hiring and firing. Additionally, fears that the conflict in the Middle East would leave a significant mark on the labour market have, so far, not materialised, with firms participating in the Survey on the Access to Finance of Enterprises reporting that the conflict has had a minimal impact on their employment expectations (see Box 2).
Private consumption accelerated in the second quarter of 2026, but momentum is likely to moderate in the near term. Private consumption expanded by 0.4%, quarter on quarter, in the second quarter of the year, after showing nil growth in the previous quarter (Chart 6). Domestic spending was supported by both services, amid favourable tourism flows, and goods, despite a decline in spending on non-durables. The saving rate remained stable at 14.3% in the first quarter. Turning to the third quarter, high-frequency indicators point to a moderation in household spending momentum as the economic impact of the conflict in the Middle East gradually unfolds (see Box 4). Retail sales declined by 0.6%, month on month, in July, standing 0.4% below their average level in the second quarter, mainly owing to a drop in online sales, as well as electronic equipment and fuel. The European Commission’s consumer confidence indicator recovered in July and August on average, mainly owing to households’ expectations for the general economic outlook. The rebound is helping services recover from the initial energy shock. Based on the European Commission’s business surveys across sectors, consumer expected activity also improved in July and August, driven by retail trade, accommodation and food services, travel services, and food products, partly offset by energy products. These signals were confirmed by the Consumer Expectations Survey (CES), which indicated that consumer confidence and spending partly recovered in July, especially for discretionary items, such as travel services. Looking ahead, elevated energy prices and uncertainty related to the conflict in the Middle East should weigh on consumption. Moreover, tight – albeit softening – credit supply conditions could further weigh on household spending momentum according to the CES and the euro area bank lending survey. However, these negative effects may be cushioned by resilient income and wealth dynamics, which have supported private consumption since the end of 2022, amid historically low household indebtedness and leverage levels.
Chart 6
Household consumption, consumer expected activity and household savings
(quarter-on-quarter percentage changes, percentage point contributions; standardised percentage balances; percentages of gross disposable income)

Sources: Eurostat, European Commission and ECB calculations.
Notes: “Consumer expected activity” refers to a weighted average of business expectations for the next three months with regard to production for manufacturing, employment for construction, business for trade and demand for services from the European Commission business survey, weighted according to the sectoral shares in euro area private consumption from the FIGARO input-output tables for 2023. The series is standardised for the whole sample from January 1999. The latest observations are for the first quarter of 2026 for the saving rate, the second quarter of 2026 for private consumption, goods and services, and August 2026 for consumer expected activity.
Business investment contracted somewhat in the second quarter of 2026 but is expected to gather pace in the second half of the year, underpinned by continued spending on digitalisation and expanding defence. Non-construction investment (excluding volatile Irish intellectual property products) contracted by 0.1%, quarter on quarter, in the second quarter of the year, amid heightened uncertainty and elevated energy costs (Chart 7, panel a). Intangible investment contributed positively while machinery and equipment weighed on business investment. Both tangible and intangible assets are gaining momentum in the third quarter of 2026, as shown by rising confidence in the capital goods and digital services sectors. Expected investment in the second half of 2026 and beyond continues to be driven by AI technology and digitalisation. Tangible investment is being boosted by demand for AI-related hardware, robotisation and defence-related products, especially in semiconductor-producing countries. In the capital goods sector demand is now less of a limiting factor than space and equipment, according to a European Commission survey. Intangible investment continues to be spurred by digitalisation. Cloud expansion and the adoption of AI are leading to data centres now being increasingly built in southern European countries thanks to their renewable energy, land and access to Next Generation EU funds. At the same time, shortages of skilled workers and concerns about energy availability, permit complexity and the implementation of new EU regulations pose challenges to digitalisation. Looking ahead, investment growth should be underpinned by rising demand, an increasing gross operating surplus and improving confidence, while higher interest rates and uncertainty about the Middle East remain a drag (see Box 2).
Chart 7
Real investment dynamics and survey data
a) Business investment
(quarter-on-quarter percentage changes; percentage balances and diffusion index)

b) Housing investment
(quarter-on-quarter percentage changes; percentage balances and diffusion index)

Sources: Eurostat, European Commission, S&P Global Market Intelligence and ECB calculations.
Notes: The lines indicate monthly developments, while the bars refer to quarterly data. The PMIs are expressed in terms of the deviation from 50. In panel a), business investment is measured by non-construction investment excluding Irish intangibles. For the confidence indicators, “tangibles” refers to the capital goods sector (the producers of tangible machinery and equipment) and “intangibles” is a weighted average of the subsectors supplying investment related to intellectual property products, i.e. publishing activities (NACE J58); computer programming and consultancy (NACE J62); and information activities (NACE J63). In panel b), the line for the European Commission activity trend indicator refers to the weighted average assessment of the building and specialised construction sectors of the trend in activity over the preceding three months, rescaled to have the same standard deviation as the PMI. The line for PMI output refers to housing activity. The latest observations are for the second quarter of 2026 for investment, and August 2026 for PMI output and the European Commission indicators.
Housing investment continued to decline in the second quarter of 2026 but is expected to return to positive growth in the near term. Housing investment fell by 1.3%, quarter on quarter, in the second quarter, following a decline of 1.9% in the previous quarter (Chart 7, panel b). The decline was relatively broad-based among the largest euro area countries, but particularly pronounced in Italy, where some of the weakness may reflect timing effects related to the phasing-out of financial renovation incentives. Meanwhile, production in building construction and specialised construction activities was, on average, 0.8% higher in the second quarter than in the preceding quarter. Survey-based activity indicators provide mixed signals for the third quarter, with the PMI housing output index standing, on average, above its second-quarter level in July and August, while the European Commission’s indicator of recent trends in building and specialised construction activity fell below its second-quarter level, and weather-related constraints reached record highs. At the same time, residential building permits continued to increase, with the three-month-on-three-month growth rate standing at 1.2% in May. According to the European Commission’s consumer survey, households’ intentions to undertake home improvements rebounded in the third quarter, while intentions to purchase or build a home remained broadly stable. However, the ECB’s July euro area bank lending survey points to some weakening in credit demand, with banks reporting lower demand for housing loans in the second quarter and expecting a further decline in the third quarter. Overall, housing investment is likely to return to positive growth in the near term, although the recovery is expected to remain gradual.
The recent rebound in euro area goods exports does not yet point to a broad-based strengthening in export momentum. Extra-euro area goods export volumes increased by 2.1% in the three months to June, following a weak first quarter. National accounts data for the second quarter also show total exports rising by 3.4%, quarter on quarter. However, this outcome should be interpreted with caution, as it was affected by volatile Irish exports linked to multinational enterprise activity, which have limited links to underlying euro area trade momentum. Exports to the United States also edged up in June, but the increase was concentrated in goods not directly affected by tariffs, including some AI-related products such as data centre computing, memory, storage and networking equipment, while tariffed exports continued to falter. This suggests that higher US trade barriers imposed last year may still be weighing on affected categories. Survey indicators remained subdued, with PMI new export orders only just rebounding into positive territory after four and a half years, although technology-related export orders continued to show relative strength, supported by the global AI buildout. The conflict in the Middle East appears to have been less disruptive than previously expected, with supply constraints remaining limited and receding, but higher costs and uncertainty continue to weigh on the outlook. Overall, euro area exports are projected to grow more slowly than foreign demand in the shorter term, implying a further decline in export market shares. This partly reflects the recent strength of global demand for AI-related goods, especially core data centre components such as computing, storage and networking hardware, where the euro area is less specialised than some competitors. Over the rest of the projection horizon, market shares are expected to remain under pressure from broader competitiveness challenges. On the import side, national accounts data show imports rising by 1.5%, quarter on quarter, in the second quarter, implying a positive contribution from net trade to euro area GDP growth of 0.9 percentage points.
The baseline projections foresee annual real GDP growth of 0.9% in 2026, 1.4% in 2027 and 1.5% in 2028. Compared with the June 2026 projections, GDP growth has been revised up slightly for 2026, reflecting data surprises and positive survey indicators, which imply a carry-over effect in 2027. The near-term growth outlook has improved compared with the last round of staff projections, reflecting, in particular, the resilience of private consumption and public spending. Over the medium term, gradually falling energy prices and a strong labour market should bolster household incomes and, in turn, support consumption. Growth will increasingly be supported by business and housing investment. Export growth should benefit from rising foreign demand but is being held back by competitiveness challenges and uncertainty about global trade policies. The economic outlook for the euro area remains highly uncertain amid the ongoing conflict in the Middle East and continued volatility in energy prices. To take account of this uncertainty, the baseline is complemented by updated versions of the three alternative scenarios contained in the June 2026 projections – a milder scenario, an adverse scenario and a severe scenario (see “ECB staff macroeconomic projections for the euro area, September 2026”).
3 Prices and costs
Annual euro area headline inflation, as measured by the Harmonised Index of Consumer Prices (HICP), rose to 3.3% in August 2026, up from 2.9% in July. This increase was driven by a surge in energy inflation caused by the conflict in the Middle East, while food inflation was unchanged.[5] The HICP excluding energy and food (HICPX) edged down to 2.4% in August, from 2.5% in July, owing to a fall in services inflation that more than offset the increase in non-energy industrial goods (NEIG) inflation. Indicators of underlying inflation have been broadly stable in recent months. Wages have not shown a material response to the energy shock so far. Annual growth in compensation per employee decreased to 3.3% in the second quarter of 2026, down from 3.5% in the first quarter of 2026.
The September 2026 ECB staff macroeconomic projections for the euro area foresee headline inflation averaging 3.0% in 2026, before declining to 2.5% in 2027 and 2.1% in 2028.[6] Compared with the June 2026 Eurosystem staff macroeconomic projections for the euro area, headline inflation in 2026 is unchanged, while it has been revised up for 2027 and 2028. The outlook remains highly uncertain, with risks to the upside for inflation. To illustrate this uncertainty, the baseline projections are complemented by updated versions of the three alternative scenarios contained in the June 2026 projections. These scenarios differ in terms of their assumptions regarding the magnitude and persistence of the Middle East conflict and the energy price shock, the impact of the shock on the international environment and on uncertainty, as well as the strength of indirect and second-round effects on inflation.
According to Eurostat’s flash estimate, euro area HICP inflation rose to 3.3% in August 2026, up from 2.9% in July (Chart 8). This increase was driven by a surge in energy inflation alongside stable food inflation and a slight decrease in HICPX inflation. The annual rate of change in energy prices soared to 14.3% in August from 10.3% in July, owing to a 2.9% month-on-month increase in energy prices and a significant positive base effect.[7] Food inflation stood at 1.2% in August, unchanged from July. Within the food component, processed food inflation ticked down in August, to 0.6%, from 0.7% in July, while unprocessed food inflation increased to 2.7% from 2.4% over the same period. The month-on-month changes in unprocessed food prices were stronger than usual for August, possibly reflecting some upward pressure stemming from the hot and dry weather in Europe over the summer. HICPX inflation edged down to 2.4% in August from 2.5% in July. This decline was due to the drop in services inflation, from 3.3% to 3.0%, which more than offset the increase in NEIG inflation, from 0.9% to 1.2%.
Chart 8
Headline inflation and its main components
(annual percentage changes; percentage point contributions)

Sources: Eurostat and ECB calculations.
Notes: “Goods” refers to non-energy industrial goods; HICPX stands for HICP excluding energy and food. The latest observations are for August 2026 (flash estimate).
Indicators of underlying inflation have been broadly stable in recent months (Chart 9), ranging between 2.1% and 2.6% in July 2026. After edging up in July, exclusion-based measures of inflation available for August eased slightly. Regarding model-based indicators, the Persistent and Common Component of Inflation (PCCI) ticked down to 2.1% in July, from 2.2% in June, while the PCCI excluding energy remained unchanged at 2.1%. The Supercore indicator, which comprises HICP items sensitive to the business cycle, went up slightly to 2.6% in July from 2.5% in June. Over the same period, domestic inflation, which comprises items with a low import content (mainly services items) also ticked up to 3.3% from 3.2%.
Chart 9
Indicators of underlying inflation
(annual percentage changes)

Sources: Eurostat and ECB calculations.
Notes: The grey dashed line represents the Governing Council’s inflation target of 2% over the medium term. HICPX stands for HICP excluding energy and food; HICPXX stands for HICPX excluding travel-related items, clothing and footwear. The latest observations are for August 2026 (flash estimate) for HICPX, HICPXX and HICP excluding energy, and July 2026 for the remaining indicators.
Indicators of pipeline pressures increased at most stages of the pricing chain in July 2026 (Chart 10). At the early stages of the pricing chain, energy producer price inflation rose to 12.9% in July 2026 from 8.8% in June, while energy import price inflation declined to 18.2% from 21.8% over the same period. Nevertheless, both indicators remained elevated, pointing to continued strong energy-related price pressures. Regarding intermediate goods, pressures also remained elevated on the back of large increases in domestic producer price inflation and import price inflation, which jumped to 6.3% and 8.8% respectively in July. In the same month, at the later stages of the pricing chain, indicators of pipeline pressures on non-food consumer goods signalled stronger inflationary pressures, with increases in both import price inflation and domestic producer price inflation, rising to 0.7% and 2.4% respectively. Following elevated pressures in 2025, pipeline price dynamics on food prices continued to be weak and remained firmly in negative territory. For manufactured food, the annual growth rate of producer prices was unchanged, at ‑1.2% in July, interrupting the gradual downward trend that had started in September 2025, while that of import prices increased somewhat to ‑2.0% in July from ‑2.6% in June. Owing to the ongoing conflict in the Middle East, developments in energy and food prices, as well as pipeline pressures more broadly, are being closely monitored.
Chart 10
Indicators of pipeline pressures
(annual percentage changes)

Sources: Eurostat and ECB calculations.
Note: The latest observations are for July 2026.
Domestic cost pressures, as measured by growth in the GDP deflator, remained unchanged at 2.4% in the second quarter of 2026 (Chart 11). This reflects a decline in contributions from unit labour costs (from 2.0% to 1.5%) and from unit taxes (from 0.3% to 0.2%), offset by an increase in contributions from unit profits (from 0.1% to 0.7%). The decrease in the annual growth rate of unit labour costs (from 3.5% to 2.6%) was driven by an increase in labour productivity growth (from 0.0% to 0.7%) reinforced by a decrease in the annual growth rate of compensation per employee (from 3.5% to 3.3%). This latter decrease reflects a decline in the growth rate of negotiated wages, which slowed to 2.4% in the second quarter of 2026, down from 2.6% in the first quarter, as well as a small drop in the contribution from the wage drift component to 0.9 percentage points, down from 1.0 percentage points over the same period. Looking ahead, the ECB wage tracker, which has been updated with data on wage agreements negotiated up to the end of August 2026, suggests that pressures on negotiated wages will stabilise at 2.6% in 2026 before increasing slightly to 2.7% in the first half of 2027.[8] The September 2026 projections expect the annual rate of growth in compensation per employee to slow from 3.8% in 2025 to 3.3% in 2026. In 2027 and 2028 it is expected to stay at 3.3%, above its long-term average, supported by the improving economic outlook and the resilient labour market. The expected decline in inflation is seen to keep wage pressures contained.
Chart 11
Breakdown of the GDP deflator
(annual percentage changes; percentage point contributions)

Sources: Eurostat and ECB calculations.
Notes: Compensation per employee contributes positively to changes in unit labour costs; labour productivity contributes negatively. The latest observations are for the second quarter of 2026.
Over the review period from 11 June to 9 September 2026, short-term market-based measures of inflation compensation increased slightly amid heightened volatility, while longer-term inflation expectations were still firmly anchored at around 2% (Chart 12, panel a). Investors’ near-term inflation outlook closely followed swings in oil prices and remained highly sensitive to uncertainty surrounding the evolution of the Middle East conflict. Following the signing of the Memorandum of Understanding between the United States and Iran on 17 June 2026, market-based measures of inflation compensation declined. However, by early July they had risen to above the levels seen prior to 17 June as the conflict re-escalated and oil prices rose. At the end of the review period, the one-year forward inflation-linked swap rate one year ahead had increased by around 15 basis points, to stand at 2.3%. For medium and longer-term maturities, inflation compensation measures remained relatively stable, with the five-year forward inflation-linked swap rate five years ahead broadly unchanged over the review period, at around 2.2%. Once adjusted for inflation risk premia, market-based measures of medium and longer-term inflation expectations remained firmly anchored at around 2%. In both the ECB Survey of Professional Forecasters for the third quarter of 2026 and the ECB Survey of Monetary Analysts for September 2026, average and median longer-term inflation expectations remained at 2%.
Chart 12
Market-based measures of inflation compensation and consumer inflation expectations
a) Market-based measures of inflation compensation
(annual percentage changes)

b) Headline HICP inflation and the ECB Consumer Expectations Survey
(annual percentage changes)

Sources: LSEG, Eurostat, ECB Consumer Expectations Survey and ECB calculations.
Notes: Panel a) shows forward inflation-linked swap rates over two different time horizons for the euro area. The vertical grey line indicates the start of the review period on 11 June 2026. In panel b), the dashed lines show the mean rate and the solid lines show the median rate. For panel a), the latest observations are for 9 September 2026. For panel b), the latest observations are for August 2026 for both HICP inflation (flash estimate) and the Consumer Expectations Survey.
Consumers’ short and medium-term inflation expectations edged up in August 2026, while perceptions of past inflation remained unchanged (Chart 12, panel b). According to the ECB Consumer Expectations Survey for August 2026, the median rate of perceived inflation over the previous 12 months remained stable at 3.5%.[9] Median expectations for inflation over the next 12 months increased slightly to 3.0%, from 2.9% in July, while expectations for three years ahead rose to 2.9% from 2.7% over the same period. At the same time, median expectations for inflation for five years ahead ticked up by 0.1 percentage points, to 2.5%. Looking through monthly volatility, consumers’ inflation expectations remain above the levels seen before the Middle East conflict. However, they have been broadly stable in recent months, continuing to signal a return of inflation to target over the medium term.
The September 2026 projections expect headline inflation to increase from 2.1% in 2025 to 3.0% in 2026, before declining to 2.5% in 2027 and then to 2.1% in 2028 (Chart 13). Headline inflation is expected to increase to 3.6% in the fourth quarter of 2026. Energy inflation is projected to peak at the end of 2026, driven by increases in energy commodity prices and by the higher increase in refined transport fuel prices compared with crude oil prices. Energy inflation is then projected to fall sharply in 2027 owing to lower energy commodity prices and negative base effects, before ticking up in 2028, owing to the introduction of the EU Emissions Trading System 2 (ETS2). Food inflation is projected to increase in the short term, amid gradually unfolding indirect effects from past increases in energy prices and the impact of adverse weather, before falling back towards 2% later in the projection horizon. HICPX inflation is expected to rise gradually over the short term and to average 2.5% in 2026 and 2.6% in 2027, reflecting the gradual build-up of the indirect effects of higher energy prices both domestically and globally as import prices and manufacturing input costs increase. It is then expected to decline to 2.3% in 2028. Compared with the June 2026 projections, the outlook for headline HICP inflation has been revised up by 0.2 percentage points for 2027, and by 0.1 percentage points for 2028. HICPX inflation has been revised up by 0.1 percentage points for both 2027 and 2028.
Chart 13
Euro area HICP and HICPX inflation
(annual percentage changes)

Sources: Eurostat and ECB staff macroeconomic projections for the euro area, September 2026.
Notes: The grey vertical line indicates the last quarter before the start of the projection horizon. The latest observations are for the second quarter of 2026 for the historical data and the fourth quarter of 2028 for the projections. The September 2026 projections were finalised on 28 August 2026 and the cut-off date for the technical assumptions was 19 August 2026. Both historical and projected data for HICP and HICPX inflation are reported at a quarterly frequency.
4 Financial market developments
Over the review period from 11 June to 9 September 2026, short-term market rates in the euro area were primarily driven by developments in the Middle East conflict and their effects on energy prices, leading market participants to adjust their near-term inflation outlook. Amid some volatility, short-term risk-free rates ended the review period broadly unchanged. Meanwhile, long-term risk-free rates rose to historically high levels, reflecting a synchronised increase in global bond yields. Euro area sovereign bond yields moved largely in line with risk-free rates. Equity valuations strengthened over the review period, with the euro area and US stock market indices recording broadly similar increases on the back of robust corporate earnings. Gains on both sides of the Atlantic were concentrated in the financial sector, bolstered by a steeper yield curve, while technology stocks remained volatile. Corporate bond spreads narrowed in both the investment-grade and high-yield segments. In foreign exchange markets, the euro appreciated against the US dollar (+1.0%) and in trade-weighted terms (+0.4%).
Euro area short-term risk-free rates ended the review period broadly unchanged, despite some intra-period volatility driven by developments in the Middle East conflict, while longer-term risk-free rates rose globally (Chart 14). The benchmark euro short-term rate (€STR) stood at 2.19% at the end of the review period, reflecting the Governing Council’s decisions to raise the three key ECB interest rates by 25 basis points at its meeting on 11 June 2026 and keep them unchanged at its subsequent meeting on 23 July. Excess liquidity decreased by around €101 billion to €2,117 billion, which mainly reflected the continuing decline in the portfolios of securities held for monetary policy purposes. Short-term rates displayed pronounced intra-period volatility as market participants reassessed the inflation outlook in response to developments in the Middle East conflict and related fluctuations in energy prices. However, short-term rates ended the review period broadly unchanged: the €STR forward curve on 9 September 2026 implied cumulative policy rate hikes of about 40 basis points by the end of the year, which is similar to the level priced in at the beginning of the review period. Looking beyond 2026, €STR forward rates rose relative to their level in June.
Chart 14
€STR forward rates
(percentages per annum)

Sources: Bloomberg Finance L.P. and ECB calculations.
Note: The forward curve is estimated using spot overnight index swap (OIS) (€STR) rates.
Long-term risk-free rates rose to multi-decade highs over the review period, reflecting a synchronised increase in global bond yields (Chart 15). The ten-year euro area OIS rate moved up by 37 basis points to stand at 3.2%. The ten-year US Treasury yield increased by around 38 basis points to 4.9%, while the ten-year UK gilt yield rose by around 37 basis points to 5.3%, albeit with significant intra-period fluctuations. Yields at maturities longer than ten years reached multi-decade highs. This global repricing occurred against a backdrop of surging corporate debt issuance to fund investment related to artificial intelligence (AI), particularly in the United States. In addition, substantial current and expected sovereign bond issuance worldwide has put upward pressure on yields. The increase in long-term yields over the review period extended an upward trend that has moved broadly in lockstep across jurisdictions since late 2024, driven largely by higher real term premia.[10]
Chart 15
Ten-year sovereign bond yields and the ten-year OIS rate based on the €STR
(percentages per annum)

Sources: LSEG and ECB calculations.
Notes: The vertical grey line denotes the start of the review period on 11 June 2026. The latest observations are for 9 September 2026.
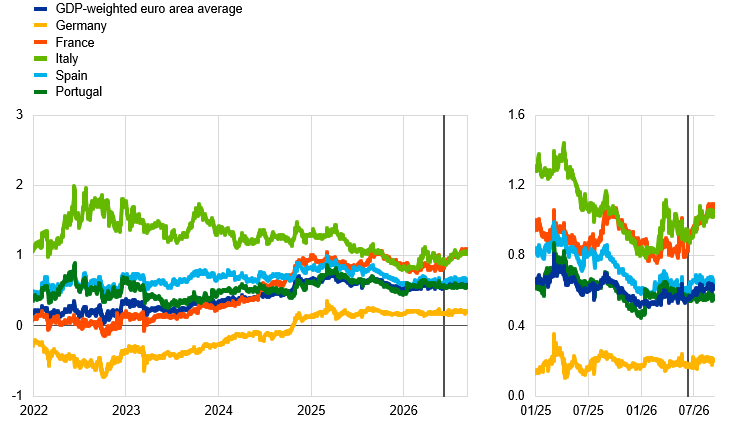
Euro area long-term sovereign bond yields increased over the review period, with spreads relative to risk-free rates remaining broadly unchanged despite some cross-country heterogeneity (Chart 16). The ten-year GDP-weighted euro area sovereign bond yield rose by 45 basis points over the review period, closing at 3.9%. Across the euro area, ten-year sovereign yields broadly tracked movements in risk-free rates, although countries with higher levels of debt saw a slight widening of spreads.
Chart 16
Ten-year euro area sovereign bond spreads vis-à-vis the ten-year OIS rate based on the €STR
(percentage points)
Sources: LSEG and ECB calculations.
Notes: The vertical grey line denotes the start of the review period on 11 June 2026. The latest observations are for 9 September 2026.
Euro area equities strengthened over the review period on the back of a positive earnings season, amid intra-period volatility reflecting developments in the Middle East conflict and concerns around the AI infrastructure buildout (Chart 17). The euro area benchmark stock market index gained 2.7% over the review period, driven primarily by higher valuations in the financial sector. While the sub-index for non-financial corporations (NFCs) lost 1.9%, bank stock prices rose by 19.2%, bolstered by a steeper yield curve and strong earnings season. Equity performance in the United States was comparable: the broad equity market index moved up by 2.8%, with NFCs and banks posting increases of 2.4% and 9.1% respectively. Technology stocks were particularly volatile in both jurisdictions, despite strong earnings, on account of their sensitivity to higher long-term interest rates and recurrent concerns about elevated valuations. This volatility also reflected uncertainty over whether the substantial investment in AI would generate sufficient earnings growth to meet the high expectations embedded in prevailing valuations.
Chart 17
Euro area and US equity price indices
(index: 2 January 2020 = 100)

Sources: LSEG and ECB calculations.
Notes: The vertical grey line denotes the start of the review period on 11 June 2026. The latest observations are for 9 September 2026.
Euro area corporate bond spreads narrowed in both the investment-grade and high-yield segments over the review period. The narrowing was most pronounced in the high-yield segment, where spreads tightened by about 9 basis points. Investment-grade spreads declined by approximately 3 basis points for both NFCs and financial firms.
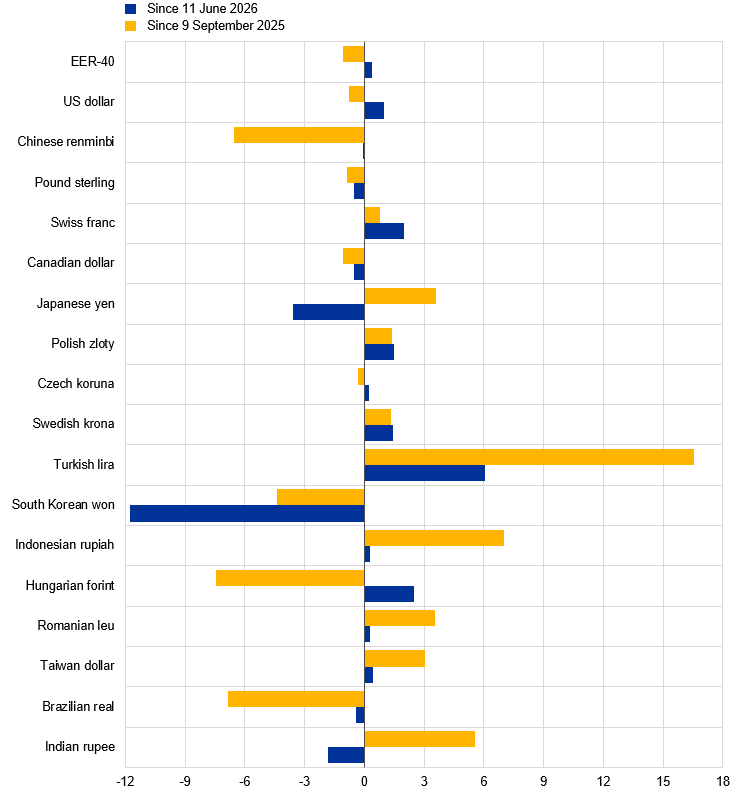
In foreign exchange markets, the euro appreciated against the US dollar and in trade-weighted terms (Chart 18). The strengthening against the US dollar (+1.0%) was driven mainly by shifts in market expectations concerning the monetary policy stance of the Federal Reserve System. Meanwhile, the nominal effective exchange rate of the euro – as measured against the currencies of 40 of the euro area’s most important trading partners – edged up by 0.4% amid mixed bilateral exchange rate developments. The euro appreciated against the Swiss franc (+2.0%), the Polish zloty (+1.5%) and the Hungarian forint (+2.5%), while losing ground against the pound sterling (‑0.5%), the South Korean won (‑11.8%) and the Japanese yen (‑3.6%). The JPY/EUR exchange rate exhibited relatively high volatility during the review period. In late July the United States and Japan launched a coordinated foreign exchange rate market intervention, which initially prompted an appreciation of the yen. However, most of these gains had been reversed by the end of August. The yen appreciated sharply against the euro from the start of September, mainly reflecting shifts in market expectations regarding the Bank of Japan’s monetary policy stance.
Chart 18
Changes in the exchange rate of the euro vis-à-vis selected currencies
(percentage changes)
Source: ECB calculations.
Notes: EER-40 is the nominal effective exchange rate of the euro against the currencies of 40 of the euro area’s most important trading partners. A positive (negative) change corresponds to an appreciation (depreciation) of the euro. All changes have been calculated using the foreign exchange rates prevailing on 9 September 2026.
5 Financing conditions and credit developments
Financing conditions for firms and households have remained broadly stable since the Governing Council’s meeting on 23 July 2026. In July, bank lending rates stood at 3.8% for firms, slightly above the levels in May, and remained at 3.5% for households. Over the review period from 11 June to 9 September 2026, both the cost to non-financial corporations of market-based debt and the cost of equity increased, reflecting higher long-term risk-free rates and a higher equity risk premium. Growth in loans to firms increased further in July to 4.4%, while growth in loans to households was broadly unchanged at 3.1%. The annual growth rate of broad money (M3) increased to 3.4%.
Bank funding costs were broadly unchanged in June and July, having been on an overall upward trend since March (Chart 19). The composite cost of debt financing for euro area banks stood at 1.7% in July. Bank bond yields increased slightly in the same month, reflecting upward pressure in global bond markets, but their spreads remained compressed. Interbank rates increased following the Governing Council’s decision to raise the three key ECB interest rates in June. The composite deposit rate, which measures the marginal cost of bank deposit funding, edged up slightly to 1.0% in July, reflecting higher interest rates on time deposits as banks passed on the increase in policy rates. At the same time, rates on overnight deposits and savings accounts were broadly unchanged.
Chart 19
Composite bank funding costs in the euro area
(annual percentages)

Sources: ECB, S&P Dow Jones Indices LLC and/or its affiliates, and ECB calculations.
Notes: The composite cost of debt financing is an average of new business costs for banks for overnight deposits, deposits redeemable at notice, time deposits, bonds and interbank borrowing, weighted by their respective outstanding amounts. The composite cost of deposits is calculated as the average of new business rates on overnight deposits, deposits with an agreed maturity and deposits redeemable at notice, weighted by their respective outstanding amounts. The latest observations are for July 2026 for the composite cost of debt financing and the composite cost of deposits, and 9 September 2026 for bank bond yields.
Up to the end of July bank lending rates rose for firms while remaining stable for households (Chart 20). The cost of bank borrowing for non-financial corporations rose to 3.8% in June and July, from 3.6% in May. Rate increases were concentrated in loans with longer fixation periods (over five years). The spread between interest rates on small and large loans to firms tightened slightly, as lending rates increased relatively less for small and medium-sized enterprises than for large firms. The cost of borrowing for households for house purchase was broadly unchanged at 3.5% in June and July.
Chart 20
Composite bank lending rates for firms and households in the euro area
(annual percentages)

Sources: ECB and ECB calculations.
Notes: Composite bank lending rates are calculated by aggregating short and long-term rates using a 24-month moving average of new business volumes. The latest observations are for July 2026.
Over the review period from 11 June to 9 September 2026, both the cost of market-based debt issued by firms and the cost of equity financing increased. The overall cost of financing for non-financial corporations – the composite cost of bank borrowing, market-based debt and equity – rose for the second consecutive month, reaching 6.5% in July (Chart 21).[11] The main drivers of this increase were the cost of equity and that of market-based debt financing, while bank borrowing costs increased only marginally. Daily data covering the whole review period show that the rise in the cost of market-based debt was due to higher risk-free rates, which were only partly offset by a small decline in corporate bond spreads, especially in the high-yield segment (see Section 4, “Financial market developments”). The cost of equity financing also increased over the review period, owing primarily to a higher equity risk premium, with the rise in long-term risk-free rates playing a smaller role.
Chart 21
Nominal cost of external financing for euro area firms, broken down by component
(annual percentages)

Sources: ECB, Eurostat, Dealogic, Merrill Lynch, Bloomberg Finance L.P., LSEG and ECB calculations.
Notes: The overall cost of financing for non-financial corporations is based on monthly data and is calculated as an average of the short and long-term costs of bank borrowing (monthly average data) and the costs of market-based debt and equity (end-of-month data), weighted by their respective outstanding amounts. The latest observations are for 9 September 2026 for the cost of market-based debt and the cost of equity (daily data), and July 2026 for the overall cost of financing and the short and long-term costs of borrowing from banks (monthly data).
Growth in loans to firms increased further in July, while growth in loans to households remained broadly unchanged from the previous months (Chart 22). The annual growth rate of bank lending to non-financial firms, which usually responds to changes in monetary policy with a longer delay, rose further to 4.4% in July. Having increased from 4.0% in May and June, it stood close to its historical average of 4.3% since the start of 1999. The annual growth rate of external debt financing by firms rose to 4.4% in July, also up from 4.0% in May and June, reflecting stronger growth in borrowing by firms from banks, while net issuance of corporate bonds remained modest. Overall, short-term loans increased strongly in the first half of the year and also in July, likely reflecting higher working capital needs amid the energy shock. The annual growth rate of loans to households was broadly unchanged, standing at 3.1% in July, below its historical average of 4.1% since the start of 1999. Growth in consumer credit and mortgage lending continued to hover around 5% and 3% respectively. Growth in other forms of lending to households, including loans to sole proprietors, remained subdued in line with historical patterns. According to the latest ECB Consumer Expectations Survey for July 2026, the Middle East conflict is continuing to adversely affect household expectations regarding credit access, although these concerns have moderated somewhat.
Chart 22
MFI loans in the euro area
(annual percentage changes)

Sources: ECB and ECB calculations.
Notes: Loans from monetary financial institutions (MFIs) are adjusted for loan sales and securitisation; in the case of non-financial corporations, loans are also adjusted for notional cash pooling. The latest observations are for July 2026.
The annual growth rate of broad money (M3) increased slightly in June and July but remained moderate overall (Chart 23). Annual growth in M3 went up to 3.4% in July, having hovered around 3% since mid-2025. It remained well below its historical average of 5.2% observed since the start of 1999. However, monthly flows showed increased volatility in the months to July, driven by large monthly swings in net foreign flows. The annual growth rate of narrow money (M1) – comprising currency in circulation and overnight deposits – decreased to 3.1% in July, down from 3.7% in May and 3.5% in June. This decline reflects sizeable deposit outflows from non-bank financial intermediaries in July, which offset some of the inflows seen in the previous months. From a counterpart perspective, domestic credit has played a larger role in money creation since the start of the Middle East conflict. By contrast, the reduction of the Eurosystem balance sheet continued to weigh on M3 growth.
Chart 23
M3, M1 and overnight deposits
(annual percentage changes, adjusted for seasonal and calendar effects)

Source: ECB.
Note: The latest observations are for July 2026.
6 Fiscal developments
According to the September 2026 ECB staff macroeconomic projections for the euro area, the euro area fiscal stance is expected to loosen in 2026 before tightening again in 2027 and 2028.[12] The projected loosening in 2026 is broad-based on the expenditure side, while the subsequent tightening reflects the reversal of temporary energy support measures, the expiry of most Next Generation EU (NGEU) financing and non-discretionary factors. The general government budget deficit, which stood at 3.0% of GDP in 2025, is projected to increase markedly to 3.6% of GDP in 2026, peak at 3.7% in 2027 and decline to 3.6% in 2028. The euro area debt-to-GDP ratio is expected rise to just below 90% of GDP in 2028, as the continuous primary deficits and deficit-debt adjustments outweigh the favourable effects of interest rate-growth differentials.
After turning neutral in 2025, the euro area fiscal stance is expected to loosen by 0.5 percentage points of GDP in 2026 before tightening by a similar amount cumulatively over 2027 and 2028.[13] The loosening in 2026 is broad-based on the expenditure side. Higher government investment reflects increased defence and infrastructure spending, particularly in Germany but also in other, smaller countries, alongside NGEU-funded expenditure. Fiscal transfers are also set to rise, driven by strong growth in pension expenditure and other social payments, as well as by NGEU-funded capital transfers to firms. Temporary energy support measures introduced by governments since the start of the conflict in the Middle East provide an additional stimulus of around 0.1% of GDP in 2026, mainly through lower indirect taxes and higher subsidies. In 2027 the fiscal stance is projected to tighten by around 0.4 percentage points of GDP, partly reflecting the reversal of these energy support measures and the expiry of most NGEU financing. This tightening is broad-based across countries, albeit partly offset by continued fiscal stimulus in Germany. The remaining tightening over 2027 and 2028 is explained by non-discretionary factors, notably fiscal drag and the decoupling of tax bases from GDP.[14] Compared with the June 2026 Eurosystem staff macroeconomic projections for the euro area, revised historical data for Germany and France point to a somewhat looser fiscal stance in 2025, while the outlook remains broadly unchanged thereafter.
The euro area general government budget balance is expected to deteriorate, with the deficit peaking well above the 3% threshold in 2027 (Chart 24). Looking back, the euro area budget deficit declined slightly from 3.1% of GDP in 2024 to 3.0% in 2025. The 2025 figure has been revised up by 0.1 percentage points compared with the June 2026 projections, mainly reflecting revised data for Germany. Looking forward, the budget deficit is projected to increase markedly to 3.6% of GDP in 2026, peak at 3.7% in 2027 and decline marginally to 3.6% in 2028. Most of the deterioration in the budget balance is expected to occur in 2026, reflecting the loosening of the fiscal stance. In addition, interest payments are projected to increase by 0.2 percentage points of GDP in 2026 and by a further 0.3 percentage points cumulatively over 2027 and 2028. Over the same period, the favourable cyclical component and the projected fiscal tightening are expected to broadly offset the continued increase in interest payments, leading to a slight improvement in the fiscal position in 2028. Compared with the June 2026 projections, the budget balance remains broadly unchanged over the projection horizon, as the base effect from the higher deficit in 2025 and the slight loosening of the fiscal stance in 2026 are offset by more favourable cyclical developments.
The euro area debt-to-GDP ratio is expected to follow an upward path over the projection horizon to reach just below 90% of GDP in 2028. This marks a reversal of the significant decline observed between 2021 and 2024. The debt-to-GDP ratio is expected to increase from 87.1% in 2025 to 89.4% by the end of the projection horizon. This increase reflects continuous primary deficits and small but consistently positive deficit-debt adjustments, which are only partly offset by favourable interest rate-growth differentials (Chart 25). Compared with the June 2026 projections, the general government debt ratio has been revised down throughout the projection horizon. This can be attributed to a lower debt ratio calculated for 2025 and more favourable interest rate-growth differentials owing to higher nominal GDP growth.
Recent fiscal governance developments have focused on excessive deficit procedures and the scope for extending the national escape clause to energy-related expenditure. The Council of the European Union opened an excessive deficit procedure for Bulgaria on 10 July, while the excessive deficit procedures for six other euro area countries are held in abeyance.[15] The Council of the EU has so far approved the activation of the national escape clause for defence expenditure for 14 euro area countries.[16] On 18 August the European Commission published a Notice providing further details on its earlier proposal to broaden the scope of the national escape clause to energy-related measures, announced as part of the European Semester Spring Package 2026.[17] The Notice explains that the extension covers measures that strengthen the structural security and resilience of the European energy system and accelerate the transition away from fossil fuels. So far only Greece and Italy have requested such an extension, although the Commission has indicated that requests submitted at a later stage would also be considered.
1 Which countries are most vulnerable to the industrial rise of China? Mapping Europe’s uneven exposure
Prepared by Ginevra Aguiari, Francesco Chiacchio, Matteo Falagiarda, Vanessa Gunnella and Emiel Cornelius Marchand
The rapid industrial transformation of China creates an uneven distribution of challenges and opportunities across EU economies. The so-called “China shock 2.0” combines a number of developments in China, including a rapid expansion of high-technology manufacturing, a stronger policy focus on industrial self-reliance and pervasive gains in price competitiveness. While these developments have intensified competitive pressures in some sectors, they may also benefit European economies through lower-cost imports, investment linkages and technological spillovers.[18] The balance of risks and opportunities differs across EU countries, reflecting differences in sectoral specialisation, integration into manufacturing value chains and exposure to sectors in which Chinese firms have rapidly expanded. Understanding this heterogeneity is important from a broader EU perspective, as asymmetric exposure to global shocks can have implications for competitiveness, investment and growth, as well as for macroeconomic convergence and the functioning of the monetary union.
More2 Navigating uncertainty: how the Middle East conflict is shaping expectations and coping strategies of firms
Prepared by Katalin Bodnár, Davide Fantino, Sara Lamboglia and Laura Lebastard
The Survey on the Access to Finance of Enterprises (SAFE) in the euro area for the second quarter of 2026 sheds light on the exposure of firms to the conflict in the Middle East, its impact on their expectations, and their coping strategies.[19] Building on earlier analysis based on the survey for the first quarter of 2026, which revealed a significant shift in expectations among firms surveyed after the outbreak of hostilities in the Middle East on 28 February 2026, ad hoc questions included in the wave for the second quarter provide further evidence on how the conflict is affecting euro area firms.[20] The latest survey round also allows us to assess whether the distribution of firms’ answers shifted after the announcement of the Memorandum of Understanding (MoU) between Iran and the United States on 14 June, with about a quarter of respondents replying after the announcement was made.[21] Maritime attacks subsequently resumed in early July, highlighting the continued relevance of firm-level analysis on the impact of the conflict.
More3 Main results of the latest euro area demographic projections
Prepared by Stephan Haroutunian, Leo Orlygsson and Joachim Schroth
The latest demographic trends suggest that the euro area population will rise temporarily before declining to stand at 358 million in 2050, the same as in 2025, albeit with a different age structure (Chart A). According to the EUROPOP 2025 projections, which were published on 16 April 2026, the population of the euro area is expected to edge up to a peak of 361.4 million in 2037 before falling afterwards.[22] The structure of the population will change significantly: the number of people aged 65 and over will increase, while the number of children (aged 0-14) and people of working age (aged 15-64) will decline.[23] The strong increase in the older population up to the middle of the next decade reflects the fact that a large contingent of the “baby boomer” generation will reach retirement age. There is then a decline in the 15-64 age group as those born during the recent period of low birth rates reach working age.
More4 The uneven journey of wholesale gas and electricity prices to consumer bills
Prepared by Friderike Kuik, Eliza Lis and Johannes Schäfer
The sharp rise in energy prices in the first half of 2026 evoked memories of the 2021-22 energy price shock, but the nature of the shock in 2026 is different in several ways. So far, the 2026 energy price shock has been smaller in scale, with more limited increases in wholesale gas and electricity prices than during the last energy crisis (Chart A).[24] The impact of wholesale gas prices on wholesale electricity prices – which is typically strong with gas prices being the marginal price-setter for electricity prices – was dampened by a shift towards electricity generated from renewables. In addition, the way in which wholesale gas and electricity prices pass through to retail prices has evolved. This box examines how changes in wholesale gas prices are transmitted to consumers, focusing on their impact on wholesale electricity prices as well as retail price-setting for gas and electricity.[25]
More5 The evolution of financial conditions in the euro area and the United States: a Macro-Finance FCI perspective
Prepared by Tilman Bletzinger, Giulia Martorana and Jakub Mistak
Shifts in market expectations for the stance of US monetary policy can influence global financial conditions, including through spillovers to the euro area. Market expectations for US policy interest rates were revised significantly in both directions over the summer, amid heightened geopolitical risks and an uncertain economic outlook. As risks and uncertainty persist, policy rate paths for both the United States and other advanced economies remain subject to further reassessments. For the United States, the impact of such monetary policy reassessments is unlikely to remain confined to the domestic economy: a large body of empirical literature finds that US monetary policy shocks are transmitted strongly to euro area financial conditions.[26]
More6 US equity market developments during the AI boom
Prepared by Magdalena Grothe, Bruno Lopes Mendes, Ana-Simona Manu and Luca Tondo
In recent years US equity valuations have been supported by strong realised and expected earnings linked to the artificial intelligence (AI) boom. The “AI boom” refers to the fast pace of innovation and growing use of AI technologies since the public release of ChatGPT in November 2022, leading to investment opportunities in many sectors across the economy and rapidly rising equity valuations. Seen through the lens of a dividend discount model, increasing equity valuations can be supported by three main factors: higher earnings expectations, lower discount rates and lower risk premia.[27] The earnings seasons earlier this year saw many US companies report strong results, with the overall earnings growth for S&P 500 firms again outperforming earlier expectations.[28] Strong earnings have fed into expectations of further increases in profits, supported by the continued expansion of AI-related investment and expectations of associated productivity gains. One way to gauge the role of earnings, interest rates and risk premia in equity returns is by applying a dividend discount model, which breaks down returns into these key components. The model decomposition shows that expectations of continued rising corporate profitability are the main factor fuelling risk asset prices in the United States (Chart A, panel a). As well as supporting valuations, high earnings expectations also dampened equity risk, as shown by a decomposition of market-based estimates of tail risks to equity prices using quantile regressions (Chart A, panel b).
More7 Liquidity conditions and monetary policy operations from 6 May to 28 July 2026
Prepared by Samuel Bieber and Christian Lizarazo
This box reviews the Eurosystem liquidity conditions and monetary policy operations in the third and fourth reserve maintenance periods of 2026. Together, these two maintenance periods ran from 6 May to 28 July 2026 (the “review period”).
More1 Scaling up European firms: the case for an EU company law regime to unlock cross-border investment, innovation and growth
Prepared by Adam Baumann, Zakaria Gati, Daphne Momferatou, Laura Parisi and Lucia Quaglietti
There is a clear structural weakness at the heart of Europe’s competitiveness challenge: European firms struggle to reach sufficient scale and face barriers to cross-border operations. EU firm entry rates are broadly comparable to those in the United States, but firms systematically fail to grow into the large, research and development (R&D) intensive enterprises that drive productivity and wage growth (Draghi, 2024, Letta, 2024). In addition, some observers argue that Europe focuses on incremental rather than breakthrough innovation (Fuest et al., 2024).
More2 Defence spending and its short and longer-term macroeconomic effects
Prepared by Cristina Checherita-Westphal, Marta Rodríguez-Vives, Tibor Lalinský and Miles Parker
Most European countries have committed to substantially increasing their spending on defence over the coming decade. This trend is underpinned by efforts towards reaching a higher target for defence spending by the North Atlantic Treaty Organization (NATO) and by recent European initiatives aiming to accelerate investment in defence and strengthen Europe’s strategic autonomy. At the June 2025 NATO summit, NATO member countries committed to spending 5% of GDP annually by 2035. At the July 2026 NATO summit, its member countries reaffirmed both that spending commitment and their support for Ukraine. The target of 5% of GDP consists of 3.5% core defence spending and 1.5% of GDP that can be devoted to other defence and security-related activities.
More https://www.ecb.europa.eu/pub/pdf/ecbu/ecb.eb_annex202606~5844c5bfa1.en.pdf© European Central Bank, 2026
Postal address 60640 Frankfurt am Main, Germany
Telephone +49 69 1344 0
Website www.ecb.europa.eu
All rights reserved. Reproduction for educational and non-commercial purposes is permitted provided that the source is acknowledged.
This Bulletin was produced under the responsibility of the Executive Board of the ECB. Translations are prepared and published by the national central banks.
For specific terminology please refer to the ECB glossary (available in English only).
The cut-off date for the statistics included in this issue was 9 September 2026.
PDF ISSN 2363-3417, QB-01-26-052-EN-N
HTML ISSN 2363-3417, QB-01-26-052-EN-Q
Legal Disclaimer:
EIN Presswire provides this news content "as is" without warranty of any kind. We do not accept any responsibility or liability for the accuracy, content, images, videos, licenses, completeness, legality, or reliability of the information contained in this article. If you have any complaints or copyright issues related to this article, kindly contact the author above.
